Claudia Angelini, Ruth Heller, Rita Volkinshtein, Daniel Yekutieli
Abstract
Chip-seq experiments are becoming a standard approach for genome-wide profiling protein-DNA interactions, such as detecting transcription factor binding sites, histone modification marks and RNA Polymerase II occupancy. However, when comparing a ChIP sample versus a control sample, such as Input DNA, normalization procedures have to be applied in order to remove experimental source of biases. Despite the substantial impact that the choice of the normalization method can have on the results of a ChIP-seq data analysis, their assessment is not fully explored in the literature. In particular, there are no diagnostic tools that show whether the applied normalization is indeed appropriate for the data being analyzed.
In this work we propose a novel diagnostic tool to examine the appropriateness of the estimated normalization procedure. By plotting the empirical densities of log relative risks in bins of equal read count, along with the estimated normalization constant, after logarithmic transformation, the researcher is able to assess the appropriateness of the estimated normalization constant. We use the diagnostic plot to evaluate the appropriateness of the estimates obtained by CisGenome, NCIS and CCAT on several real data examples. Moreover, we show the impact that the choice of the normalization constant can have on standard tools for peak calling such as MACS or SICER. Finally, we propose a novel procedure for controlling the FDR using sample swapping. This procedure makes use of the estimated normalization constant in order to gain power over the naive choice of constant (used in MACS and SICER), which is the ratio of the total number of reads in the ChIP and Input samples.
Linear normalization approaches aim to estimate a scale factor, r, to adjust for different sequencing depths when comparing ChIP versus Input samples. The estimated scaling factor can easily be incorporated in many peak caller algorithms to improve the accuracy of the peak identification. The diagnostic plot proposed in this paper can be used to assess how adequate ChIP/Input normalization constants are, and thus it allows the user to choose the most adequate estimate for the analysis.
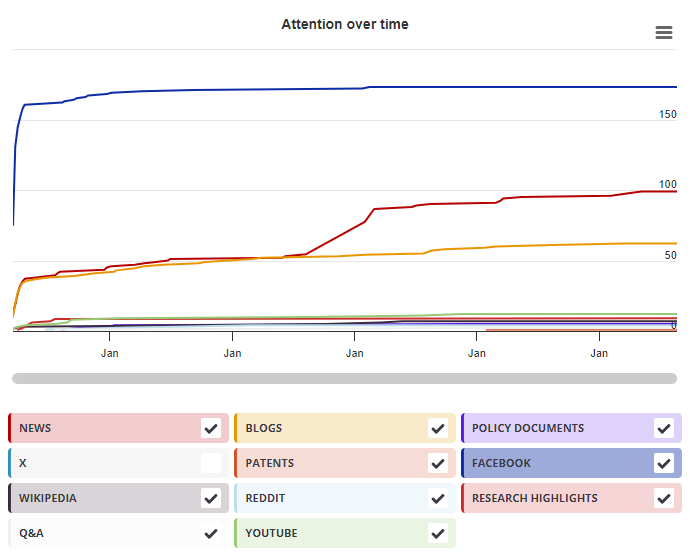
This research output has an Altmetric Attention Score of 8. This is our high-level measure of the quality and quantity of online attention that it has received. This Attention Score, as well as the ranking and number of research outputs shown below, was calculated when the research output was last mentioned on 26 February 2016.
All research outputs
#4,105,411
of 22,803,211 outputs
Outputs from BMC Bioinformatics
#1,585
of 7,281 outputs
Outputs of similar age
#52,062
of 263,982 outputs
Outputs of similar age from BMC Bioinformatics
#25
of 127 outputs
Altmetric has tracked 22,803,211 research outputs across all sources so far. Compared to these this one has done well and is in the 81st percentile: it's in the top 25% of all research outputs ever tracked by Altmetric.
So far Altmetric has tracked 7,281 research outputs from this source. They typically receive a little more attention than average, with a mean Attention Score of 5.4. This one has done well, scoring higher than 78% of its peers.
Older research outputs will score higher simply because they've had more time to accumulate mentions. To account for age we can compare this Altmetric Attention Score to the 263,982 tracked outputs that were published within six weeks on either side of this one in any source. This one has done well, scoring higher than 80% of its contemporaries.
We're also able to compare this research output to 127 others from the same source and published within six weeks on either side of this one. This one has done well, scoring higher than 79% of its contemporaries.